Dynamic Globe Visualization
Shima Dadkhahfard, Katayoon Etemad, John Brosz and Faramarz Samavati
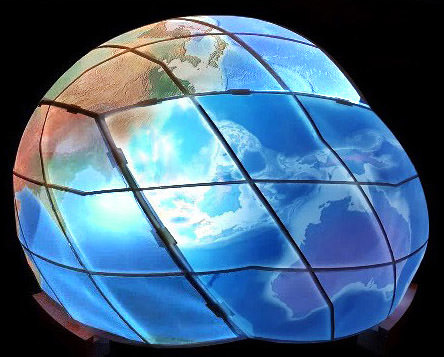
 Piecewise curved globe display. |
This project explored a methodology for creating dynamic visualization of geospatial data on a physical globe. The aim of this project was to create a curved display that would reduce the distortion inherent in viewing geospatial data. We designed a 3D printed screen and used a multi-projector setup to create the dynamic image.
 The curved display is made up of a 3D printed frame with projection paper glued in place to create the display surface. A digital projector is used to cast the image. |
The curved display is a physical representation of the globe and provides closer approximation of the Earth and reduce the perceived distortion. In our method, we use a Discrete Grid Global System (DGGS) for discretizing the Earth to hierarchical cells. This DGGS provides geospatial datasets that match the resolution of the screen

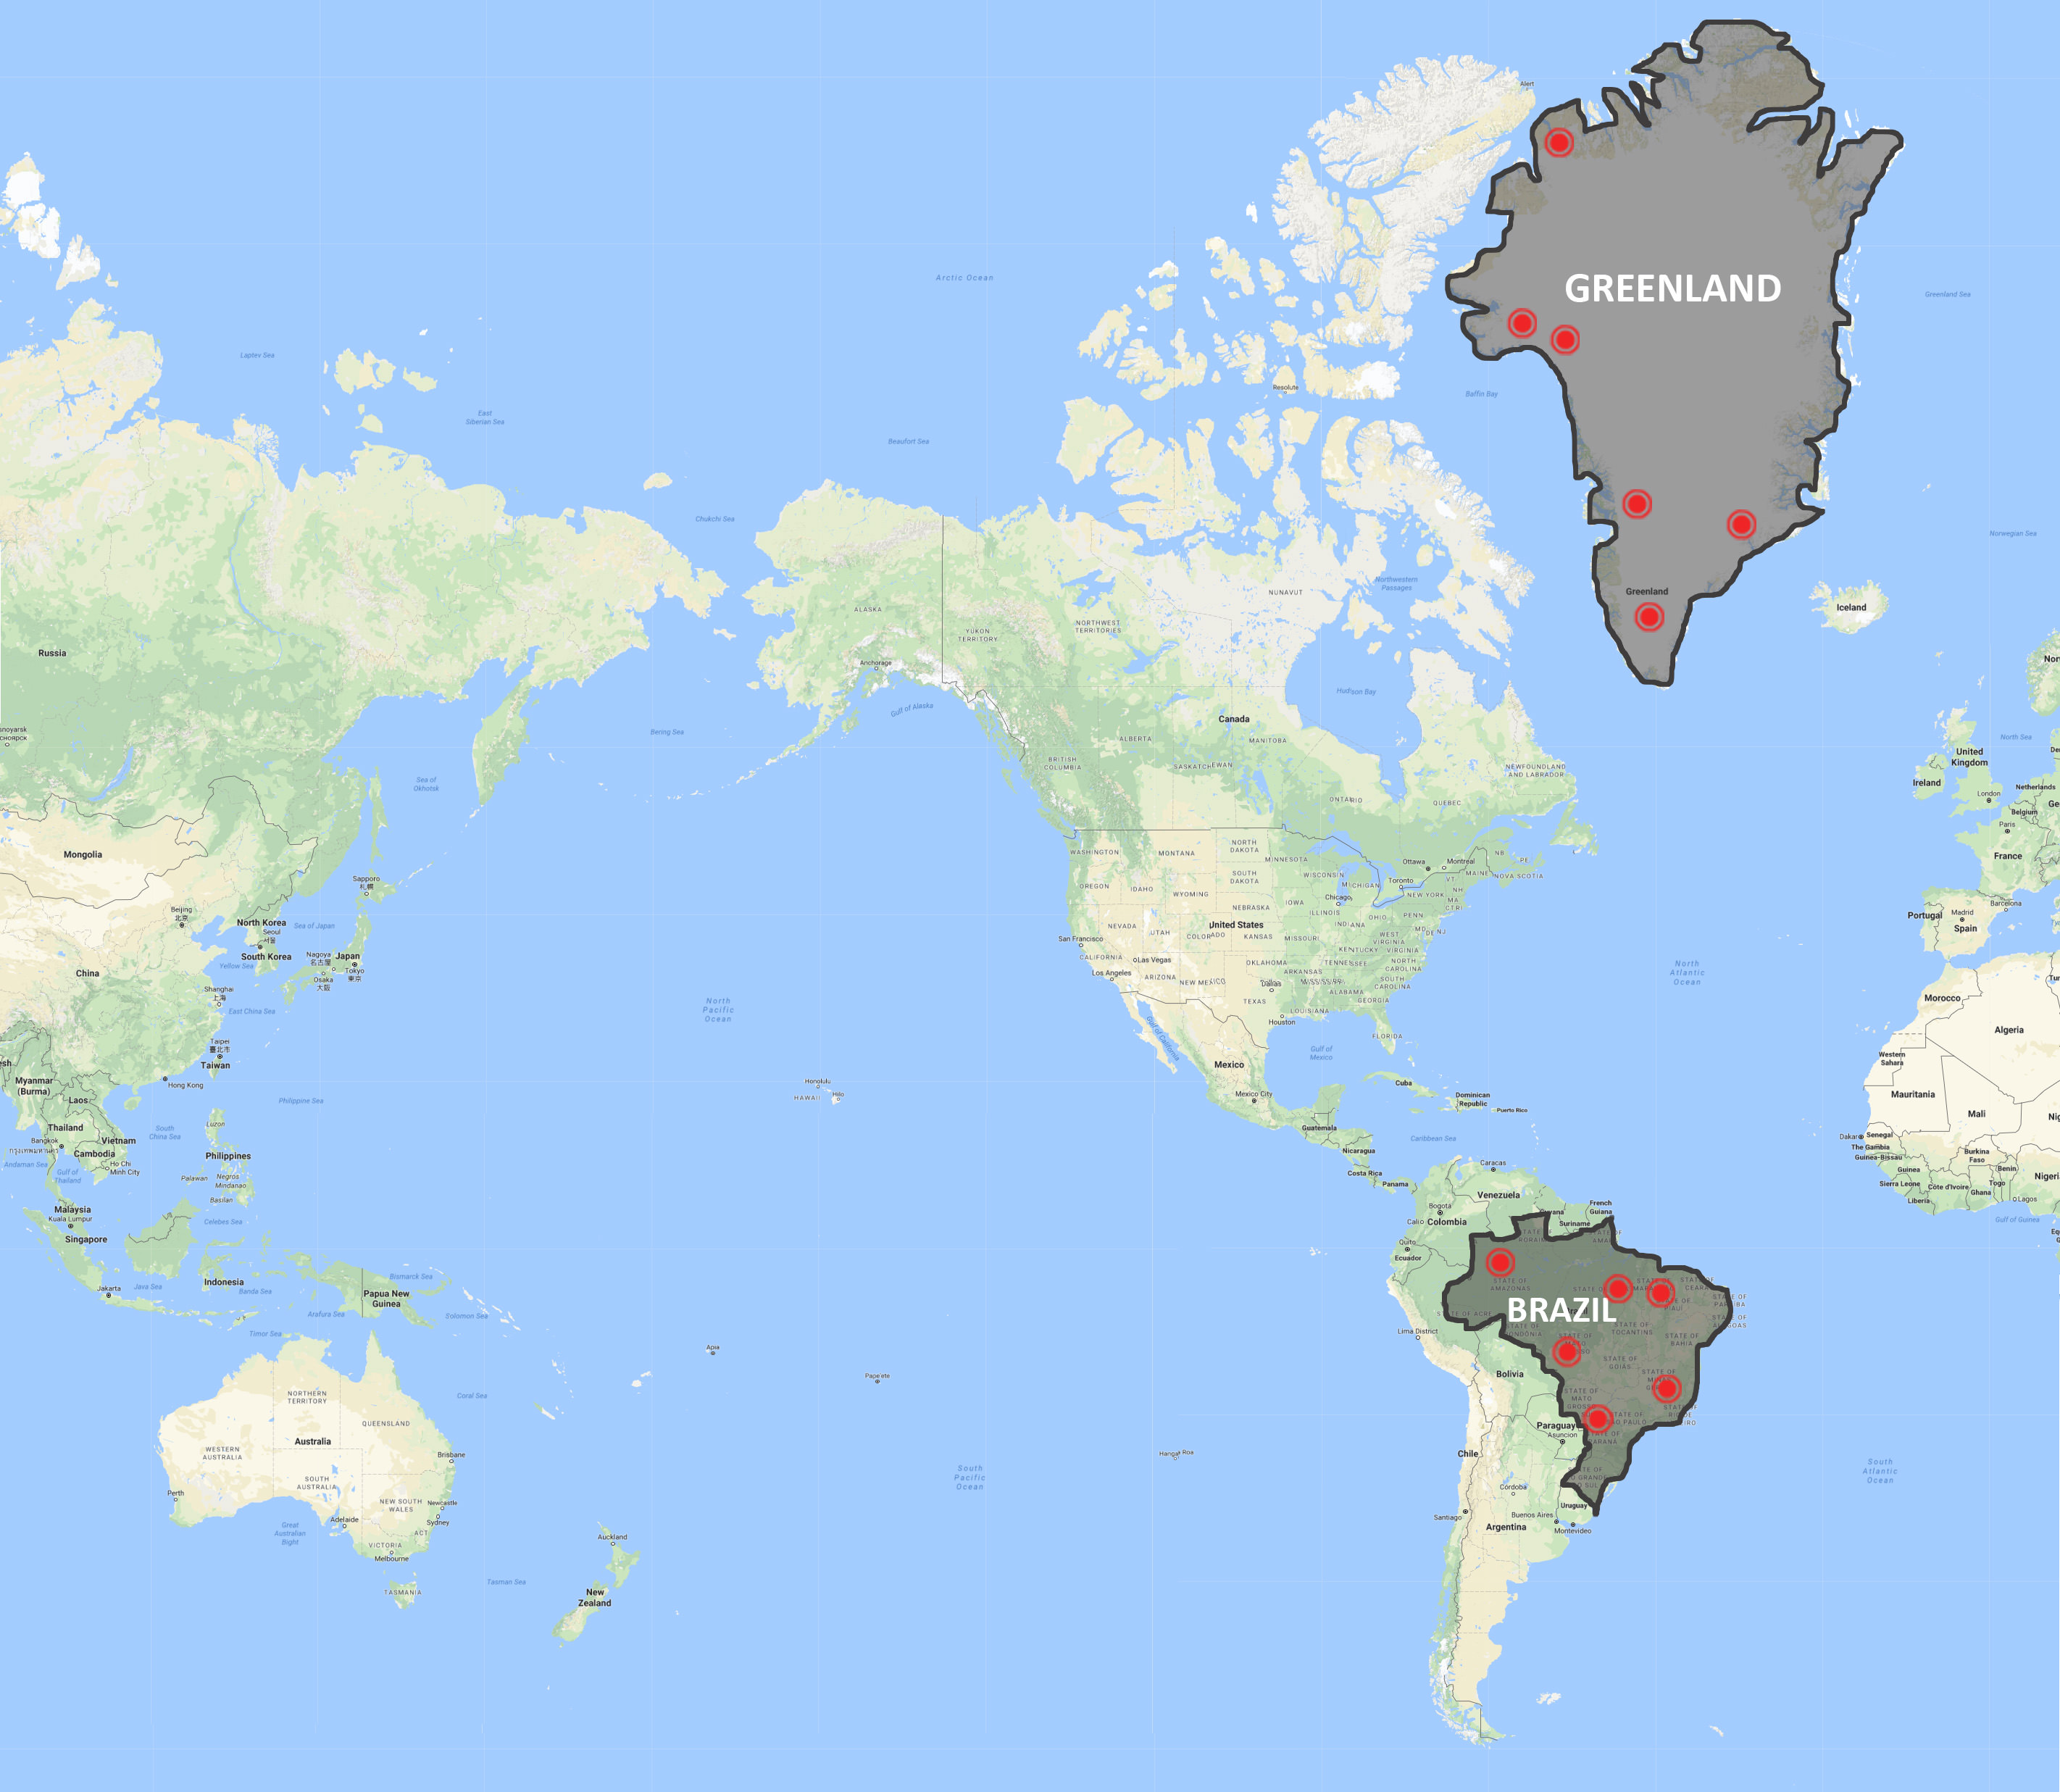
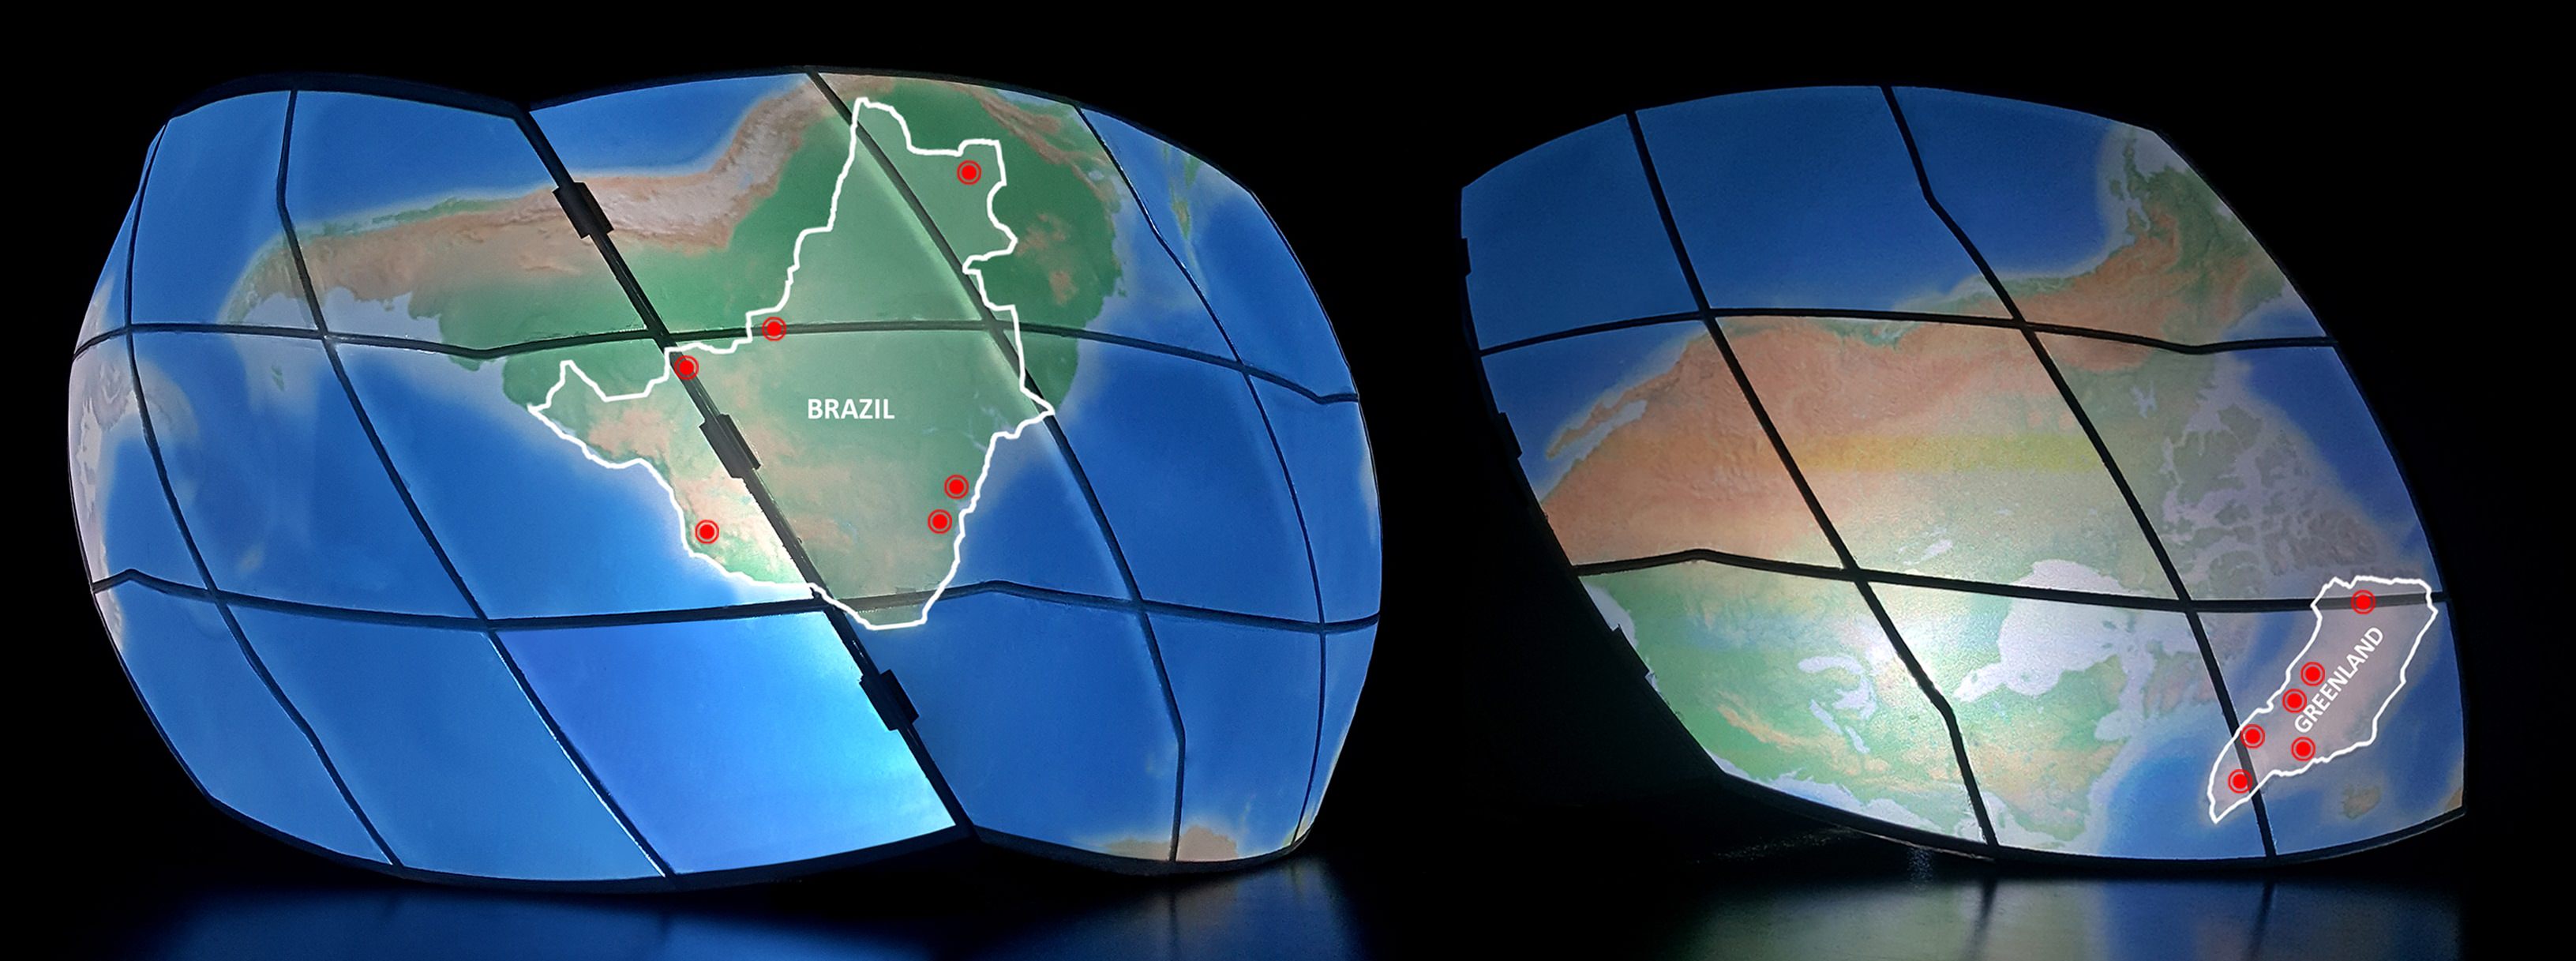
 2D map projections such as that shown on the left can distort the area such as that of Brazil and Greenland that are highlighted. Brazil is significantly larger than Green. Our curved display (right) shows a much less distorted presentation of these two area (as the shape of the screen more closely matches that of the earth. |
For controlling the projection, we developed software that takes data from DGGS, the shape of the screen, and the location of the projector(s) relative to the screen in order to create imagary that will appear correct when projected on the screen. This imagery is then fed to the projectors.
 Schematic of a setup with multiple projectors. |
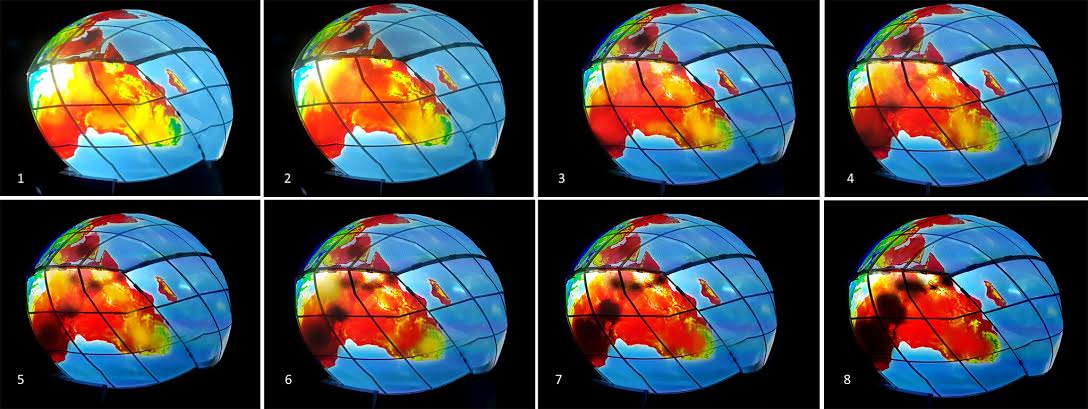
 With this digital globe, animated visualizations can be show to reveal change over time. |
Paper: Area Preserving Dynamic Geospatial Visualization on Physical Globe, Shima Dadkhahfard, Katayoon Etemad, John Brosz, and Faramarz Samavati, VISIGRAPP, Vol. 3, pp. 309-318 (January 2018). DOI: 10.5220/0006627303090318 PDF